TYPOLOGY OF OUR EDUCATIONAL MODELS
2. Explore
3. Construct
4. Solve and Check
5. In Place of a Teacher
6. Virtual Experiments
1. Visualize
One of the simplest, but at the same time most needed in teaching and learning geometry practical things is a good quality drawing. What are the advantages of MathKit, as a representative of the class of dynamic geometry software, in drawing illustrations of geometric facts and objects? Let us compare different technologies of geometry drawing.
- In the precomputer era, geometric diagrams were drawn freehand or, if accuracy mattered, using drawing tools. In any case, in order to make a substantial correction in such a diagram, one usually has to redraw it from scratch.
- Drawing with bitmap graphics software (for example, Paint), it is easier to make an accurate diagram, but it is still difficult to make corrections in it without erasing an old drawing and starting anew.
- Vector graphics software packages produce high quality and easily editable drawings. But they lack the most important feature of dynamic geometry constructions: preservation of geometric connections between their elements.
- The principal distinction of dynamic geometry, in particular, MathKit constructions as opposed to figures drawn using graphics software is that a variation of any initial element of the figure changes all the elements connected with it accordingly: a perpendicular to a line remains a perpendicular as this line is moved; the angle bisector remains the bisector; the incircle of a triangle remains the incircle and so on. So a dynamic drawing is not only accurate and easily editable, but also easily modifiable as a single dynamically connected whole, which allows us to perfectly adjust it to our particular requirements.
![]()
1.1. Complex Geometric Configuration
It's not so easy to draw an accurate figure to Euler's Nine-Point Circle Theorem by hand or using graphics software. With MathKit custom tools presented in its Toolroom menu you can do it in a couple of minutes. Not only that, the initial triangle in the model can be adjusted in such a way that all the nine points are clearly seen. The drawing thus obtained can be readily inserted in a printed document.
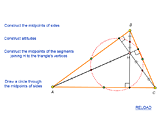 |
Nine-Point Circle |
The model above can be used in the class. It includes a presentation showing the construction step by step, and allows students to make sure experimentally that the theorem is true by varying the triangle.
Needless to say, in studying geometry it is not always necessary to have absolutely precise drawings: a proof of a fact can be found using a sketch traced out with a stick in the sand. However, a convenient tool for drawing accurate "live" illustrations, which can often suggest to a student the idea of a solution to a problem, adds a new dimension to geometry lessons.
![]()
1.2. Many in One: Desargues' Theorem
The following drawing is easy enough to construct. What's special about it is that by dragging its initial points (triangle vertices and the center O of perspective), the configuration can be transformed almost beyond recognition. And to apply the theorem, it is important to learn to single out Desargues' configuration from the figure in question. In some books Desargues' Theorem is illustrated by several figures with different arrangements of points and lines. But all possible arrangements are represented in a single dynamic model. It is very instructive to observe its transformations.
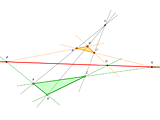 |
Desargues' Theorem |
Note that to clarify this intricate drawing, the lines in it are "trimmed" to segments that cover all their significant points of the lines, i.e., all the parent and child points of the lines. As the points move, the segments stretch or contract, following them.
![]()
1.3. Precise Function Plotting
The following example illustrates the graphical solution of the equation
The trick with this equation is that the graphs of the left-hand and right-hand sides plotted "by hand" are unexpectedly deceptive: they "clearly" show that the equation has a single solution, the one at the intersection of both graphs with the line y = x (i.e. the solution to the equation (1/16)x = x). However, it can be readily checked by substitution that the numbers x = 1/2 and x = 1/4 also satisfy the equation. Where do they come from?
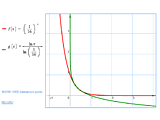 |
Solving Equation Graphically |
MathKit finds three intersection points of the two graphs, although in the vicinity of these points in "normal" scale the graphs merge together. Using the Zoom and Pan tools, you can zoom in on this area to see how the graphs interweave to form the triple intersection.
|
|
TYPOLOGY OF EDUCATIONAL MODELS |
Next page |